Imagine knowing how much local consumers spend on your particular industry – and exactly where within your local trade area these expenditures are highest. How powerful could that be?
It’s possible with retail expenditure data from the Arkansas Small Business and Technology Development Center.

Expenditure totals and household averages are available for the 27 industries within the retail sector, as well as for restaurants, bars/nightclubs, and caterers/food trucks.
Additionally, a Spending Potential Index expresses local expenditures relative to the national average.
This can be particularly useful in identifying concentrations of retail expenditures within the target area.
Retail expenditure data are available for cities and counties, as well as for custom geographic areas such as a radius or drive time around a specific street address.
And since retail expenditure data are sourced from the U.S. Bureau of Labor Statistics, you can be confident they’re reliable.
Let’s use a couple of familiar industries, grocery stores and restaurants, as examples.
Grocery stores
Arkansas consumers spend a total of $4.7 billion at grocery stores, which represents nearly $3,900 per household. The Spending Potential Index of 78 means Arkansas consumers spend 78% as much as (or 22% less than) consumers nationwide.
Viewed by county, average household expenditures at grocery stores range from more than $5,300 in Benton County to less than $2,700 in Phillips County. The household averages are lowest in Phillips County for roughly half of all retail industries.
Restaurants
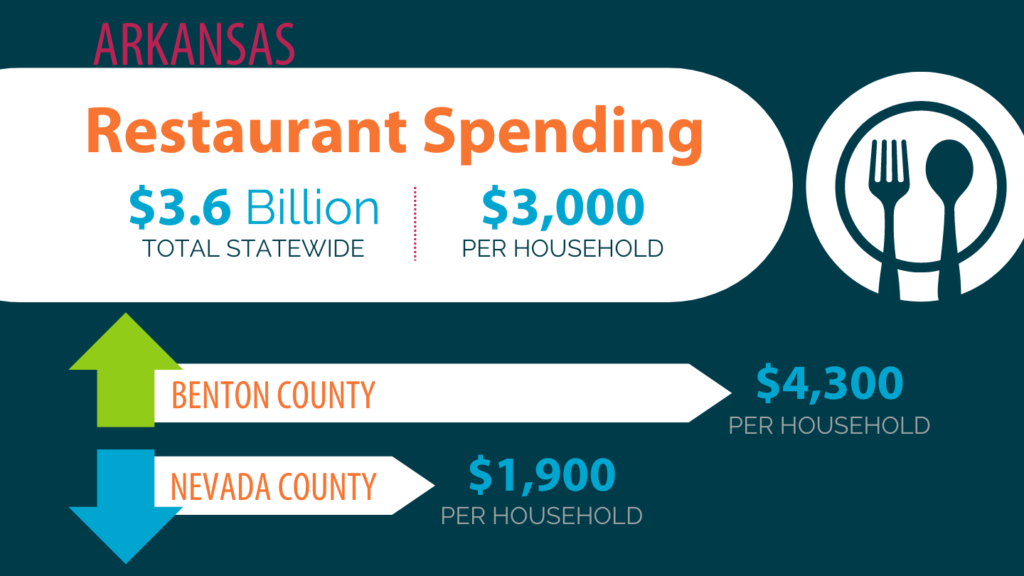
Arkansas consumers spend a total of $3.6 billion at restaurants, which represents almost $3,000 per household. The Spending Potential Index of 75 means Arkansas consumers spend 75% as much as (or 25% less than) consumers nationwide.
Viewed by county, average household expenditures at restaurants range from more than $4,300 in Benton County to less than $1,900 in Nevada County.

It’s worth noting that expenditures in Arkansas are below the nationwide average for every retail industry.
Within a particular county, analyzing expenditure data by census tract or block group can identify the areas where average household expenditures are highest.
Retail expenditure data can show which areas are likely to be most profitable for a particular type of business. The most promising area often varies from one retail industry to another.
ASBTDC’s market research experts and experienced business consultants can help small business owners use retail expenditure data to locate a new business or grow an existing one.
As you consider the market opportunity as well as potential locations, we can assist you with customized market analysis. For instance, we can compare market potential among different geographic areas or focus on one target area.
Contact your ASBTDC consultant or your local center to learn more.